E
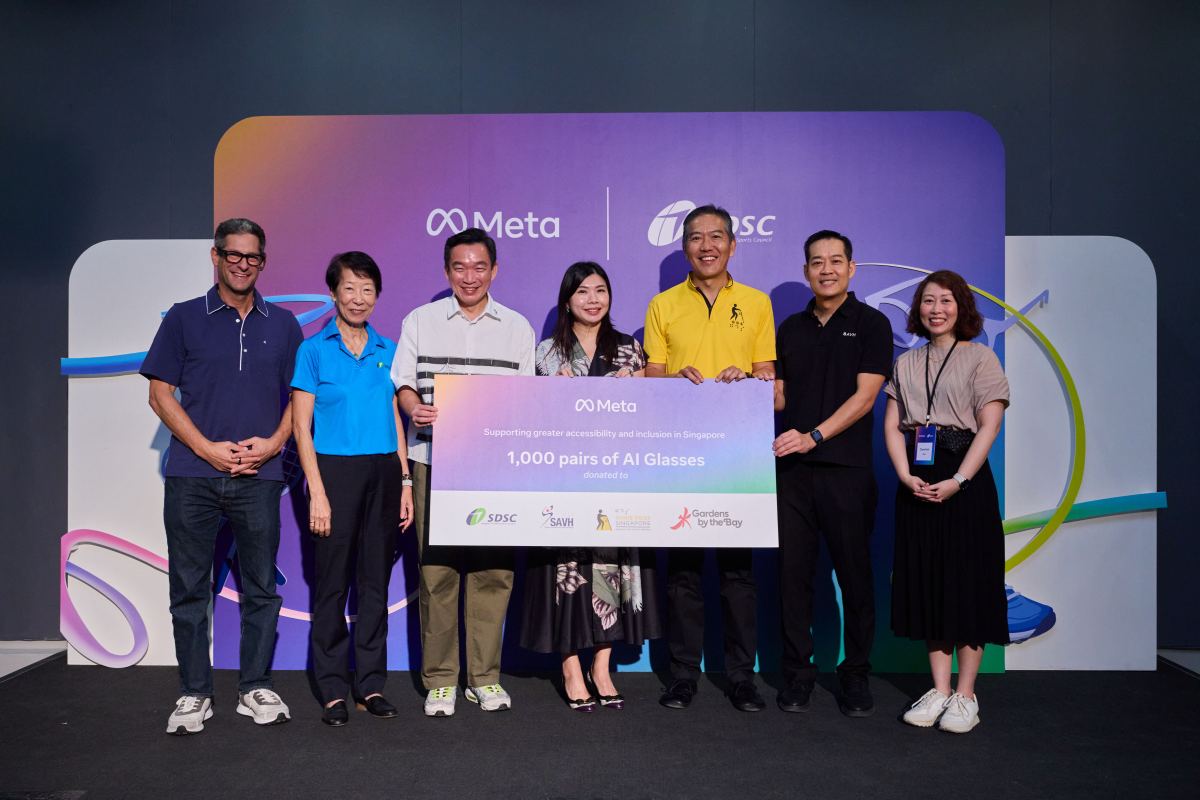
Meta is donating 1,000 Ray-Ban Meta AI glasses to four Singapore organisations (Singapore Association of the Visually Handicapped, Guide Dogs Singapore, Singapore Disability Sports Council, Gardens by the Bay), plus a US$30,000 grant for accessibility training. Meta says the glasses help blind or low-vision users read text and identify objects.
#Meta#AIGlasses#Accessibility#AI#Official
about.fb.com